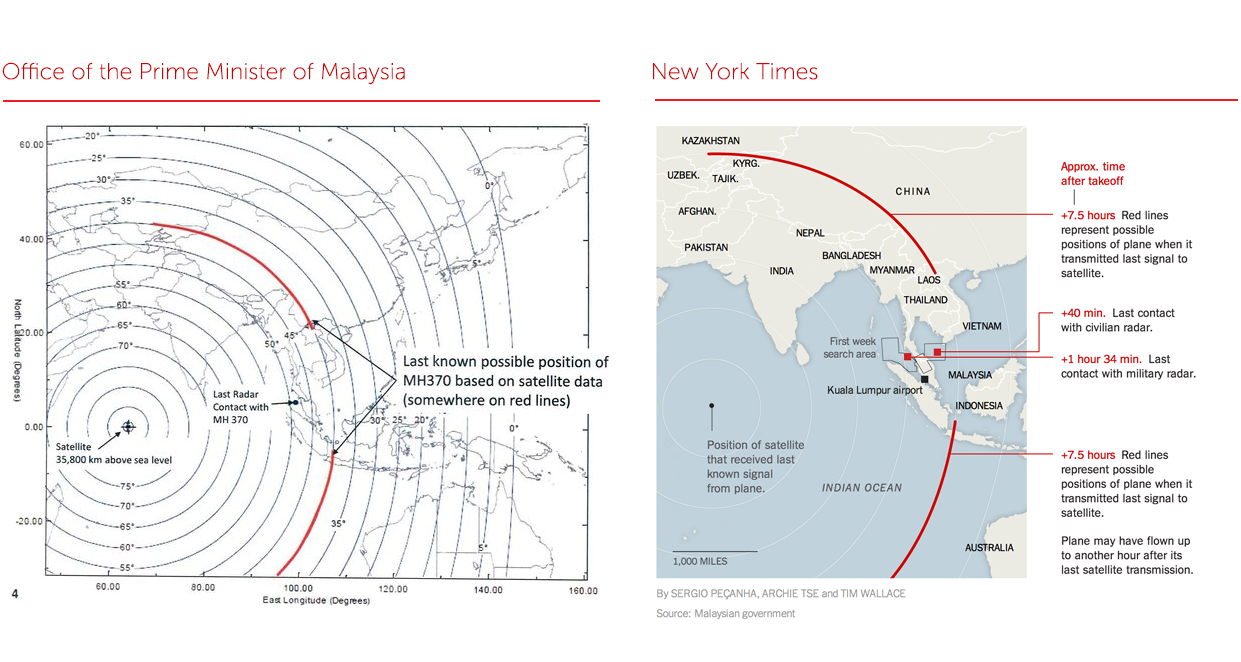
With the Malaysian airplane crisis, it’s been great seeing the NYTimes graphics department add their skills to the ongoing reportage. Often though, it takes some amount of time to create a graphic, and when news is breaking time matters. The Malaysian prime minister’s office released a line map of radar data sometime last night, and the Times printed a copy of the line map. But by today, the graphics team had taken that map and turned it into a clear map. I think it highlights the value good information design brings to visual journalists.
Here a few key things that the Times staff did to improve the PM’s map:
Remove unnecessary information The PM’s map contained latitude and longitude distance that is unrelated to the map’s central story. The Times removed these distracting axes. The PM’s map was also too widely zoomed out. While the wide zoom did show the limits of the satellite’s radar-sight, that detail wasn’t essential to the story. The Times staff focused the area of the map to the geographically most important.
Differentiate different kinds of data The PM’s map contained only black lines on a white background. The Times staff used color to differentiate the land from the ocean. They also used subtler colors to differentiate the different countries. There’s also light drop shadow showing coastal lines. I’m not sure what the drop shadow adds, but I do like the shadow on aesthetic grounds because it reminds me of old atlases. The Times staff also used color to differentiate radar sight-lines that don’t matter from those that do. And they used the highlighted radar lines to show the range of potential positions that the plane could have been at when it released its last communication. This layering of meanings is really elegant
Added commentary The Times staff removed unnecessary information, but they also added in new data and news points. There is new map data like a distance legend, country labels, and geographic labels. There is also additional event and news data. The Times staff included an earlier search area outline whose inclusion highlighted how much larger this new map is than previous search area maps. There is also a sidebar-esque timeline explaining key points of the map.
Overall, it’s an awesome clean up job that makes the map much easier to read while packing in a whole lot more data. If I had to improve anything about the map, I think I’d want to clarify the fact that the plane could either be on the north or south arc and that the different arcs really matter. It’s rare that there’s an event where we have such precise distance measurements in one dimensions, but not in another critical dimension. It would have been also interesting to think about including some visual graphic to show how the satellite receives data along these different arcs.